epic-cluster
When doing differential analysis of multiple ChIP-Seq experiments, one problem is to choose the regions that should be tested for differential enrichment. This is the problem epic-cluster tries to solve.
epic-cluster takes one merged-matrix created by the epic-merge tool and clusters the genomic bins within it to produce regions that should be tested for differential enrichment.
Several algorithms might be added to the tool; for now epic-cluster contains one, which we have called trunks, flanks and valleys.
Algorithm: trunks, flanks and valleys
Each matrix from epic-merge contains a column with the number of experiments in which the bin was considered part of an enriched region. In this example the matrix contains four experiments. The illustration below shows which regions were considered enriched in which experiments:
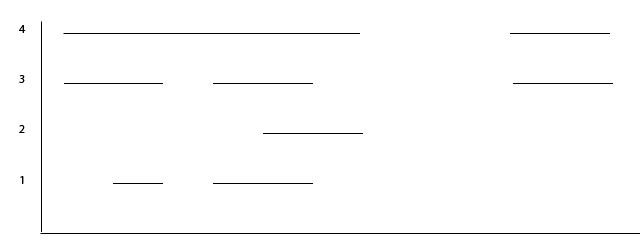
Fig. 1 Which regions are enriched in which experiments.
In the illustration below you see how this translates into clusters:
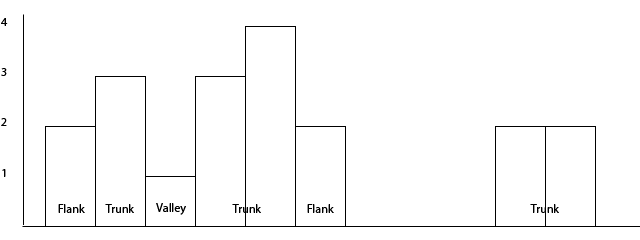
Fig. 2 The trunks, flanks and valleys algorithm.
In Fig. 2 there are two clusters of bins. The first cluster is subdivided into five regions, the second is not subdivided into any.
This algorithm first looks for genomic bins that are at most –distance-allowed apart. So if the bin-size is 200 and the –distance-allowed is 400, the data is subdivided into two clusters as seen above (since the two clusters are separated by 3 bins or 600 nucleotides).
In the first cluster the max number of enriched regions of any bin is 4 and the –trunk-diff has the default value, namely 1. So anything with 4 - –trunk-diff number of enriched regions is considered a trunk, while anything else is a flank or a valley. Flanks and valleys are regions where the total number of enriched is lower than max_enriched - trunk-diff. Flanks lie at the edges of a cluster, while valleys lie in-between trunks.
Options
-m, –matrix
A single epic-merge output matrix.
**-o, –outfile
Where to store the cluster matrix
**-B, –bedfile
Where to store the bed file with info about each cluster.
-t, –trunk-diff
The difference in number of enriched regions that decides when to consider a subregion a flank or valley, instead of a trunk. If you do not want to split clusters into flanks and valleys, you can set this to a high number.
-d, –distance-allowed
The number of nucleotides before two bins are considered to be in separate clusters.
-b, –bin-size
The bin-size used in the input matrix file. Auto-inferred by default.
-cpu, –number-cores
The number of cores to use. Can at most use one per chromosome
Example
We start with an epic-merge matrix that only includes two experiments:
zcat 0_12.gz | head
# Chromosome Bin TotalEnriched Exp1_0h.bed Exp1_12h.bed Exp2_0h.bed Exp2_12h.bed Exp1_0h_Input.bed Exp1_12h_Input.bed Exp2_0h_Input.bed Exp2_12h_Input.bed
# chr1 264400 1.0 1.0 1.0 5.0 3.0 0.0 0.0 0.0 0.0
# chr1 264600 1.0 3.0 3.0 3.0 5.0 1.0 2.0 0.0 1.0
# chr1 265200 1.0 3.0 6.0 2.0 2.0 4.0 3.0 2.0 0.0
# chr1 265400 1.0 2.0 1.0 2.0 0.0 1.0 2.0 1.0 3.0
# chr1 265800 1.0 7.0 12.0 6.0 7.0 0.0 2.0 4.0 3.0
# chr1 268400 1.0 5.0 5.0 6.0 5.0 6.0 3.0 3.0 3.0
# chr1 268600 1.0 2.0 0.0 0.0 0.0 0.0 0.0 0.0 0.0
# chr1 269000 1.0 4.0 1.0 0.0 2.0 1.0 3.0 1.0 0.0
# chr1 269200 1.0 0.0 1.0 3.0 2.0 0.0 0.0 2.0 1.0
Since it only includes two experiments, the TotalEnriched column can only include 1 or 2 (which means the bin was enriched in 1 or 2 experiments) [1].
Since the TotalEnriched-column is either 1 or 2, we set the -trunk-diff option to 0, which means that for a region where the max TotalEnriched is 2, a count of 2 will be considered a trunk, while 1 will be a flank or a valley. For a region where the max TotalEnriched is 1, everything is a trunk.
epic-cluster -cpu 25 -t 0 -m 0_12.gz -o 0_12_cluster.gz
zcat 0_12_cluster.gz
These are what the results look like:
zcat 0_12_cluster.gz | head
Index Exp1_0h.bed Exp1_12h.bed Exp2_0h.bed Exp2_12h.bed Exp1_0h_Input.bed Exp1_12h_Input.bed Exp2_0h_Input.bed Exp2_12h_Input.bed
# chr1_0_264400:264799_trunk 4.0 4.0 8.0 8.0 1.0 2.0 0.0 1.0
# chr1_1_265200:265599_trunk 5.0 7.0 4.0 2.0 5.0 5.0 3.0 3.0
# chr1_2_265800:265999_trunk 7.0 12.0 6.0 7.0 0.0 2.0 4.0 3.0
# chr1_3_268400:268799_trunk 7.0 5.0 6.0 5.0 6.0 3.0 3.0 3.0
# chr1_4_269000:269599_trunk 8.0 6.0 6.0 5.0 2.0 7.0 4.0 1.0
# chr1_5_862200:865199_trunk 19.0 27.0 20.0 35.0 11.0 12.0 10.0 8.0
# chr1_6_882000:884599_flank 25.0 22.0 16.0 27.0 17.0 15.0 8.0 13.0
# chr1_6_884600:887399_trunk 23.0 35.0 30.0 43.0 19.0 12.0 15.0 15.0
# chr1_6_887400:887599_flank 1.0 2.0 2.0 4.0 0.0 2.0 1.0 1.0
Since most tools for differential analysis are written in R, which only accepts one index column, all the data about the region is squashed into the first column.
| [1] | If epic-merge was used with the option –keep-nonenriched, the TotalEnriched column can also include 0. |